

If your household is anything like mine, your Internet connection has experienced a significant increase in usage over these last several months. We’re streaming more and more media each day, and we’re on seemingly endless hours of videoconferences for work and for school. While all of that streaming media consumes downstream capacity, those videoconferences can generate a significant amount of upstream traffic. I’m fortunate enough to have fiber-based broadband connectivity that can easily handle this traffic, but I know others aren’t as lucky. They’re stuck with copper-based connections or satellite links that struggle to deliver streaming media or video calls with any sort of viewable quality.
Across this spectrum of “last mile” Internet connections, I looked at the impact from both a provider and user perspective. What kind of traffic growth have last mile network providers experienced? What steps have these providers taken to ensure they have sufficient capacity? And most importantly for end users, how has increased traffic impacted last mile connection speeds?
The network connections from customer- and subscriber-facing Internet service providers are often referred to as last mile networks. These are Internet services delivered over a notional distance – the “last mile” – to subscriber premises, such as homes and offices, and even devices, like cell phones.
Traffic Growth
Within the United States, Comcast, Spectrum, AT&T, and Verizon are among the largest providers of consumer last mile connectivity. Based on data available as of late May, in comparison to pre-COVID baseline traffic levels (generally late February/early March), these last mile providers saw growth of more than 30% in upstream traffic, with downstream traffic increasing on the order of 20%. As expected, application traffic volumes increased significantly as well.
- Comcast reported experiencing a 33% increase in upstream traffic and a 13% increase in downstream traffic, but also noted that its network traffic is beginning to plateau in most markets, including those impacted early by COVID-19.
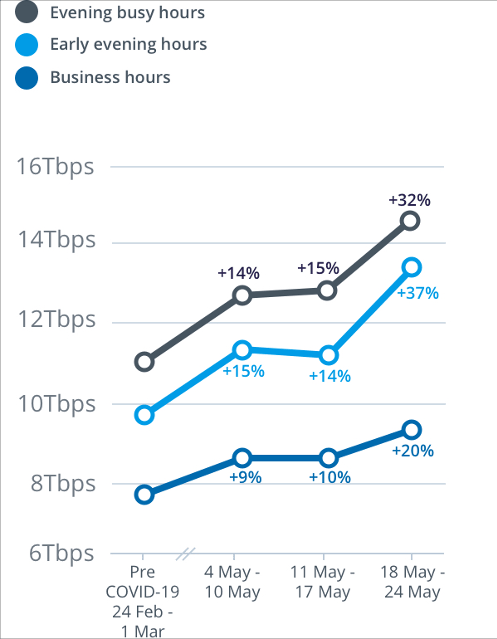
- In mid-April, Spectrum reported an increase of nearly 20% for downstream traffic and 32% for upstream traffic.
- As of the end of April, AT&T reported a 22% increase in core network traffic (which includes business, home broadband, and wireless usage) as compared to the end of February.
- In mid-May, Verizon reported significant growth at an application level, highlighting an 81% increase in VPN usage, a 1,200% increase in collaboration tool usage, and video streaming 36% higher than typical pre-COVID days.
In Europe, the Body of European Regulators for Electronic Communications (BEREC) publishes summary reports based on data collected from National Regulatory Authorities (NRAs) regarding Internet traffic across network providers in EU member states. The report published on 8 May stated, “In general, traffic on fixed and mobile networks has increased during the Covid-19 crisis, but no major congestion issues have occurred. For more than six weeks, a growing number of NRAs have been reporting a stabilization in overall traffic.” Other NRAs reported they “have been detecting a decrease in overall Internet traffic from the peak that was reached after the beginning of the Covid-19 crisis,” while several others “confirmed that data traffic keeps decreasing, but still remains at a higher level compared to the period before the outbreak of Covid-19.” Similar observations were made in the 20 May report.
In Australia, National Broadband Network peak downstream traffic was up as much as 37% over a late February baseline, according to figures published by NBN Co., the operators of the network. Monthly figures published by NBN Co. showed a slight increase in network availability from February to March, although network congestion got worse over that same time period.
(Source: https://www1.nbnco.com.au/corporate-information/about-nbn-co/updates/dashboard-march-2020, retrieved May 27, 2020)
A more extreme change in traffic volumes, however, was seen by at least one telecommunications provider in Venezuela, where the national quarantine began on 17 March. Telefonica SA subsidiary Movistar said, “the increase in data use during the first week of refuge for Venezuelans was equal to the full increase for all of 2019.”
Scaling Capacity
In Venezuela, Movistar’s radical growth in traffic placed significant strain on the network, since the network was already operating at maximum capacity, according to a letter from the company’s president. Because maintaining sufficient excess capacity within a network to be able to absorb unexpected (and planned) traffic spikes is considered an industry best practice, Movistar’s issues speak to the greater fragility of telecommunications infrastructure within Venezuela.
Other network providers are working to maintain resilience by accelerating planned investments to add additional capacity. One example is Vodacom South Africa, which announced on 15 April it would spend R500 million (approximately USD 27 million) within two months to add network capacity, especially as it sees peak traffic levels throughout the day.
However, the increased traffic appears to be less of an issue for providers in other regions. Executives from United States-based broadband provider Cox Communications noted its current network has enough capacity to handle the sudden shift in usage trends resulting from increases in online activity during the pandemic, and attributed its resilience to execution of long-term network upgrade plans. NTT Communications in Japan reassured customers “the company’s telecommunications facilities are built to handle traffic even if it doubles the current peak amount.” As of mid-April, traffic on NTT’s broadband service was approximately 28 percent higher than late February.
Within the United Kingdom, OpenReach noted its existing network is already built to handle peak capacity. BT’s Chief Technology Officer stated “We have more than enough capacity in our UK broadband network to handle mass-scale homeworking.” TalkTalk said it was confident it could manage an increase in traffic volumes as its services regularly experience peaks in demand.
Connection Speed Trends
Although you may be paying your Internet service provider for a certain level of connectivity, determining what speed you are actually getting can be challenging. Measurements can be impacted by local factors, including WiFi or cellular signal quality, and external factors, such as the location of the speed testing server. In addition, there are multiple ways calculating effective connection speeds, from active single- and multi-connection tests to passive analysis of data exhaust. No single measurement tells a complete story, so it is encouraging that a number of organizations have published insights into trends in both fixed and mobile connection speeds and how they have changed over the past several months.
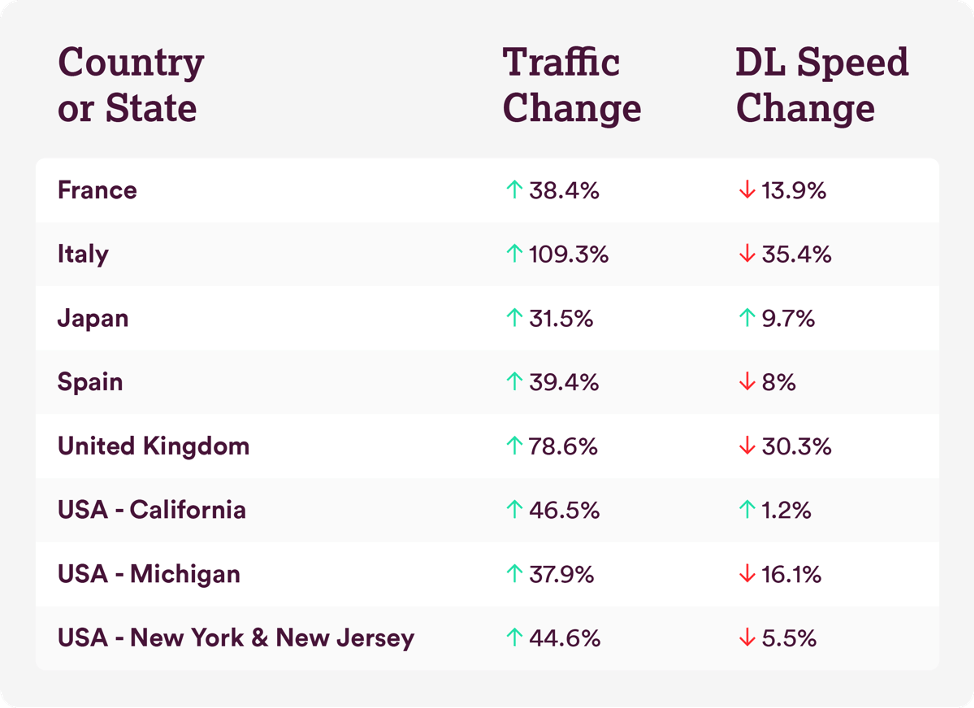
Performance monitoring company Ookla (operators of speedtest.net) initially published “Tracking COVID-19’s Impact on Global Internet Performance” in mid-March. It has updated the data each week since, tracking changes to mobile and fixed connection speeds in more than 100 countries. Using the week of March 2nd as a baseline, they’ve observed a wide range of changes. As of the 27 May update, average fixed connection speeds have declined as much as 28% (in Ethiopia), and increased as much as 127% (in Lebanon). Average mobile connection speeds have dropped as much as 30% (in Sri Lanka) and have grown as much as 89% (in Trinidad & Tobago). Median declines were in a similar range, but increases were lower.
On April 8, CDN provider Fastly published “How COVID-19 is affecting internet performance,” based on the analysis of data exhaust from their platform. They looked at download speed changes for four European countries, Japan, and four locations in the United States. Although their findings were mixed, they did note that at the time of publication, “the majority of those who are able to stay home are already there, meaning that the most extreme cases of speed degradation have already occurred.”
(Source: https://www.fastly.com/blog/how-covid-19-is-affecting-internet-performance)
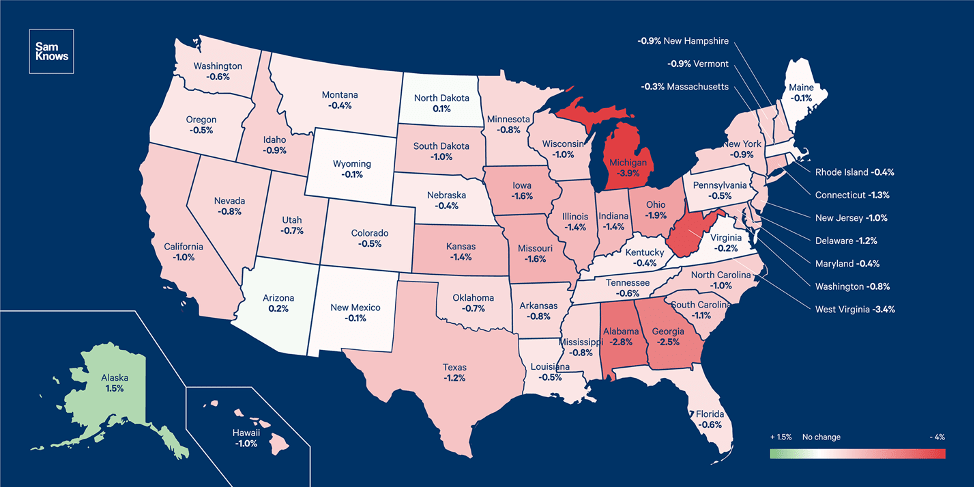
On 14 April, performance testing company SamKnows published a blog post that looked at changes to fixed connection speeds in the United States, comparing performance from 12 March (before lockdown) to performance from 24 March (after most states went into lockdown). They found that almost all states had seen a nominal drop in download speeds, with most around 1% or less. However, they also noted that because these were averages, they may hide more significant drops in speed seen by some users.
(Source: https://samknows.com/blog/samknows-critical-services-report-fixed-speed-usa)
Other surveys of connection speed trends during the pandemic have been published by OpenSignal (looking at 4G download speeds globally), BroadbandNow (tracking changes to upload and download speeds), Fing (focusing on European Internet performance), and CIRA (looking at speeds in the context of Canada’s digital divide).
NOTE: A globally exhaustive review of these changes would result in a blog post too long to read, so I looked at a limited number of countries within this post. However, based on my review of available information, shifts in traffic patterns and changes in traffic volumes and connection speeds have been within the same general ranges in other countries as well.
Last Mile Resilience
“Events” often strain the resilience of last mile networks, whether a sporting event driving millions of simultaneous streams or an eagerly anticipated software release resulting in millions of concurrent downloads. Although these events drive massive spikes in traffic, they are generally limited in duration, mitigating the long-term impact to network capacity and connection speeds.
Lockdown actions taken in response to the COVID-19 pandemic, however, have made event-level traffic the new normal across many of these networks, with traffic peaks now persisting throughout the day as many now work and learn from home.
When individual subscriber connections, whether fixed or mobile, are challenged to keep up with the increased demand, it results in users experiencing lower connection speeds.
However, last mile networks have remained fairly resilient overall, despite massive increases in both upstream and downstream traffic.
Localized community networks initiatives such as NYC Mesh are also bringing last mile resilience to areas where broadband connectivity is unavailable or unaffordable. It is now more important than ever that broadband connectivity, whether fixed or mobile, is available and affordable to all.
Learn how community networks play a key role in ensuring Internet resilience, then get involved!
Image by Andrew Neel via Unsplash