This page shows the Charts and Tables created from the 2014 Email Integrity Audit data. Charts are rounded to remove decimals and tables are rounded to one decimal point. Click on the chart or table you would like to view to be brought to that figure or scroll through the page to browse.
- Figure 1 – Email Trust Scorecard
- Figure 2 – Failing Grades By Category
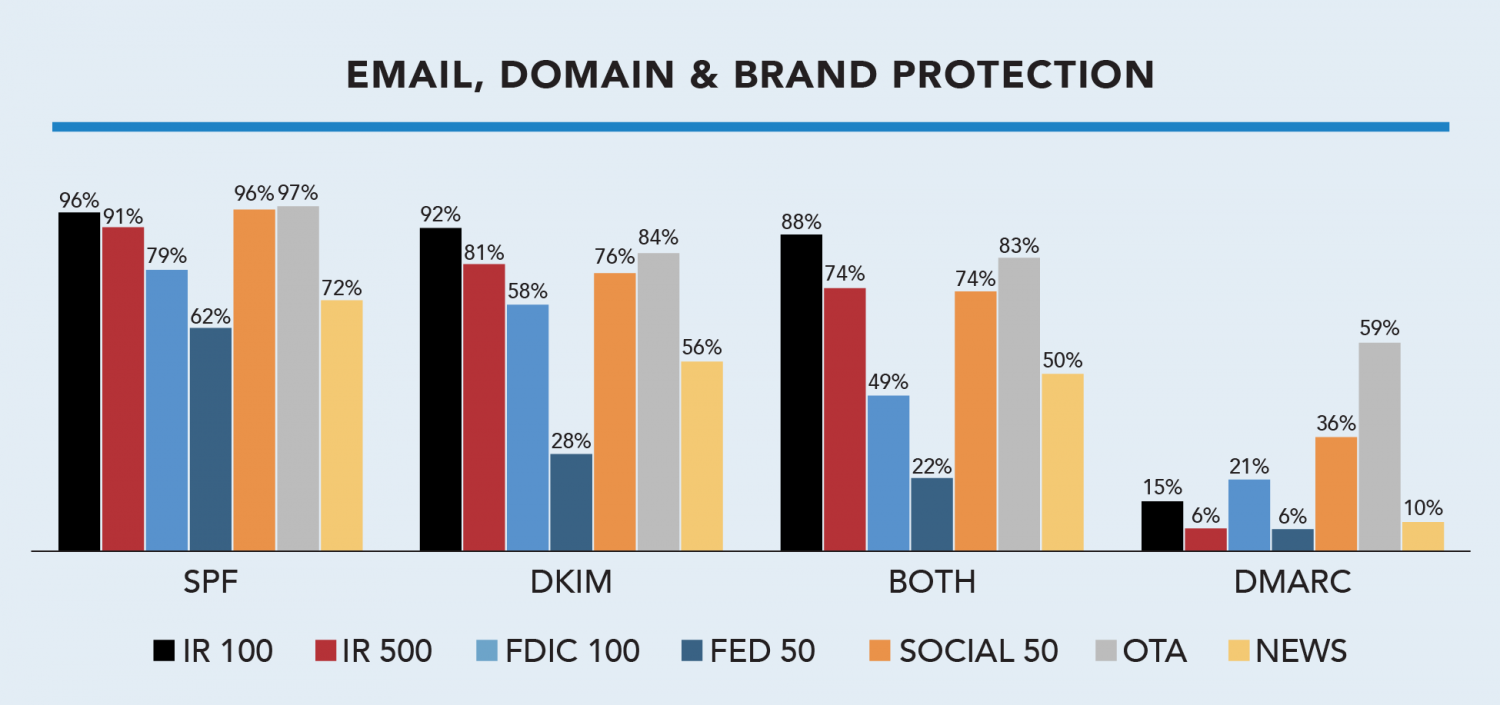
- Figure 3 – Email, Domain & Brand Protection
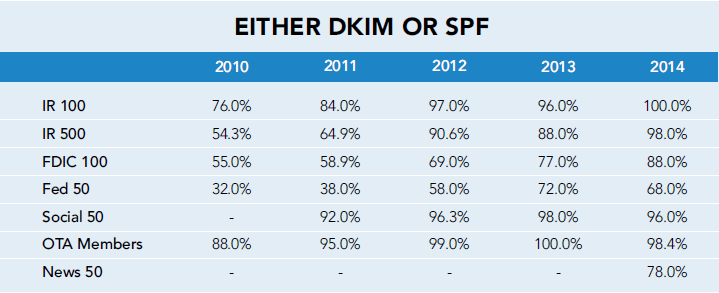
- Figure 4 – Either DKIM or SPF
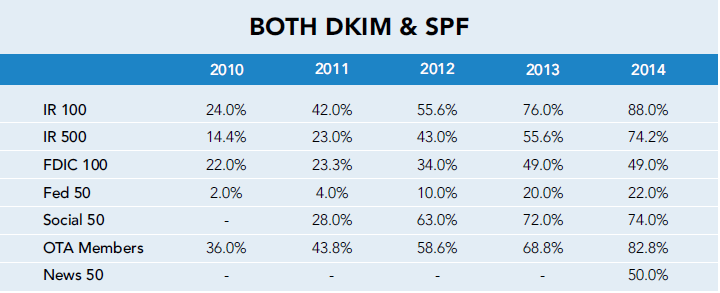
- Figure 5 – Both DKIM & SPF
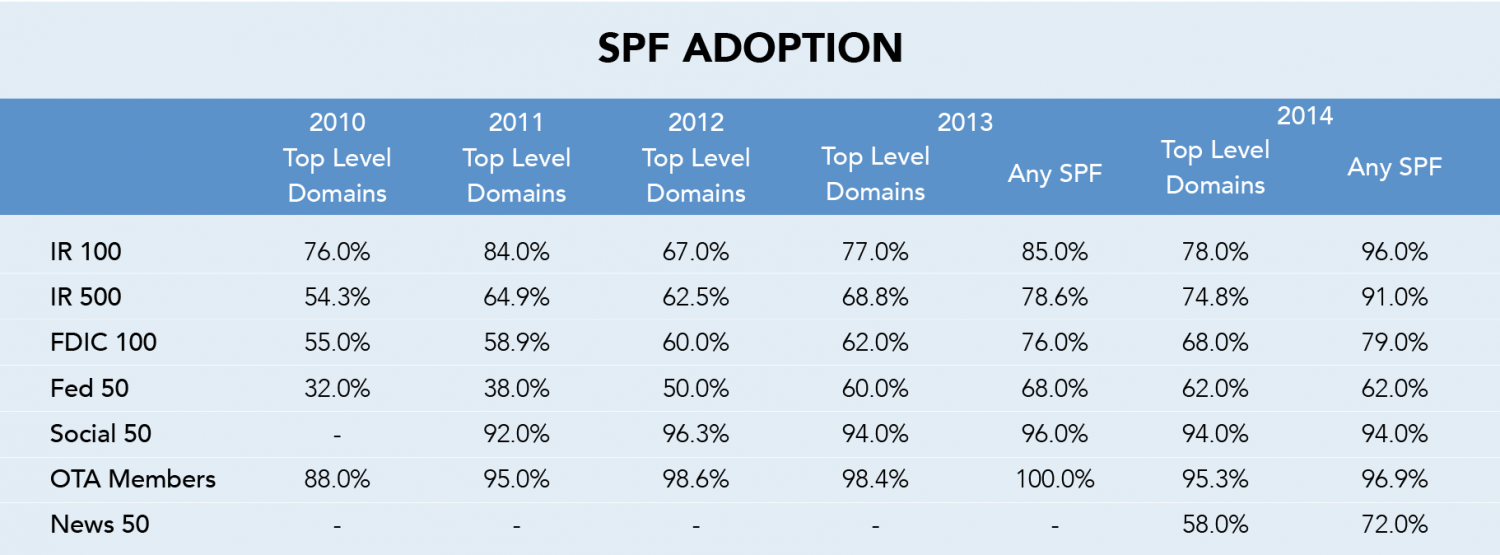
- Figure 6 – SPF Adoption
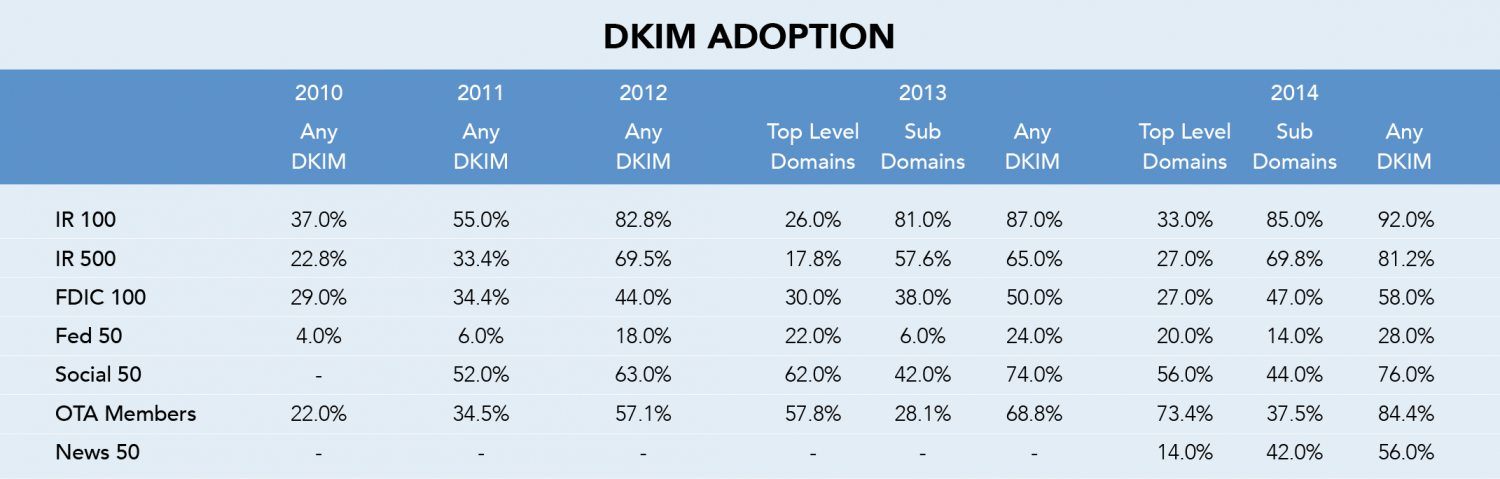
- Figure 7 – DKIM Adoption
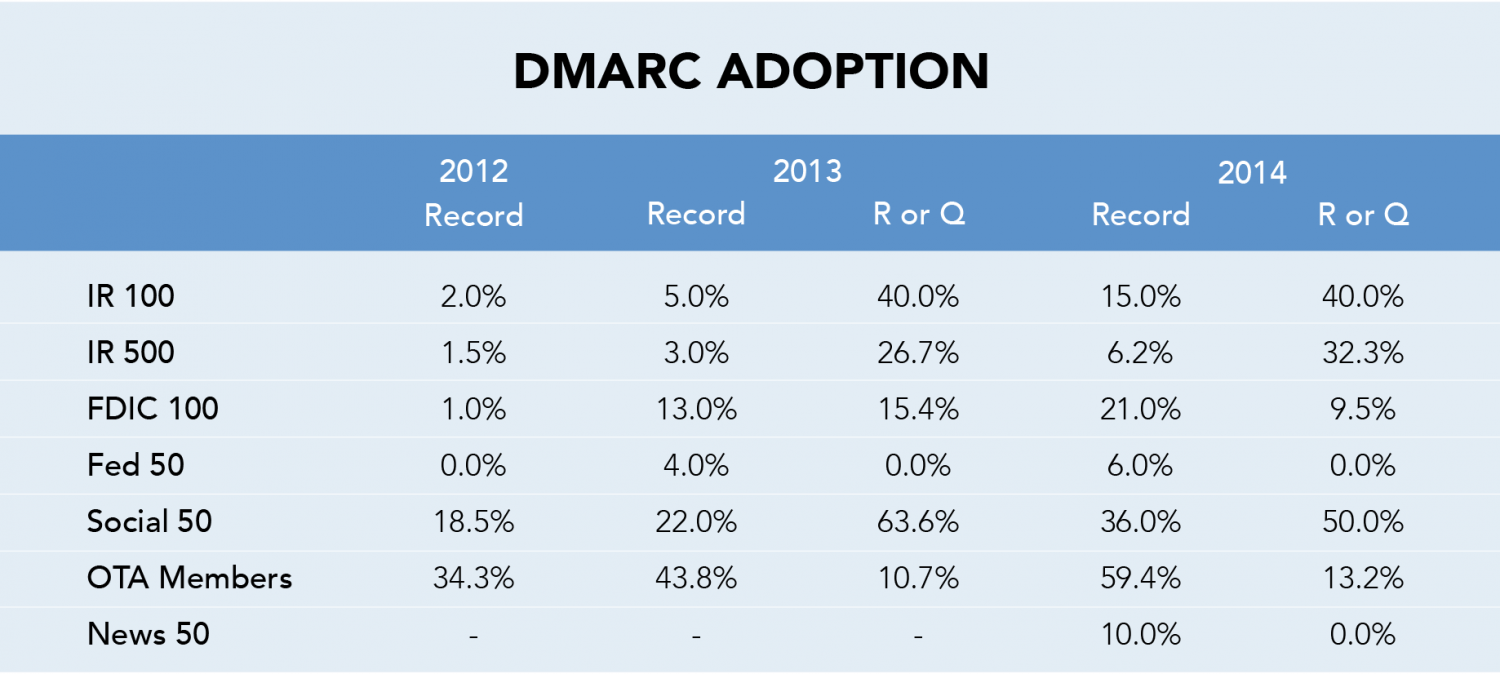
- Figure 8 – DMARC Adoption
Figure 1 – Email Trust Scorecard
Percent of each category that implemented SPF, DKIM and DMARC at their top level domain. OTA members represent early adopters with 63% passing. OTA members were netted out of calculation for ‘Total’ adoption to avoid bias in scoring.
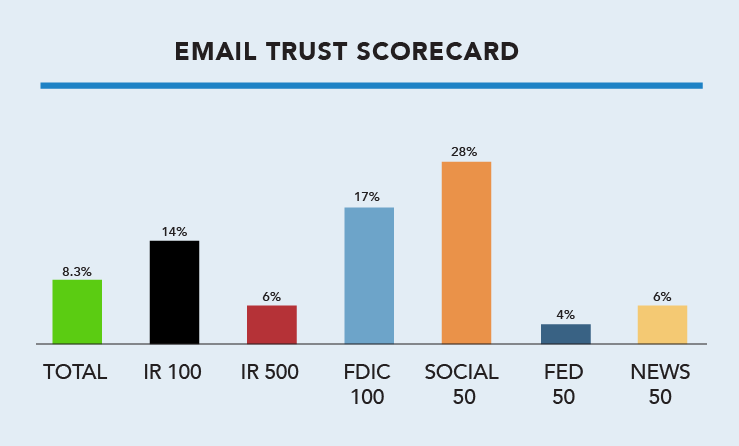
Figure 2 – Failing Grades By Category
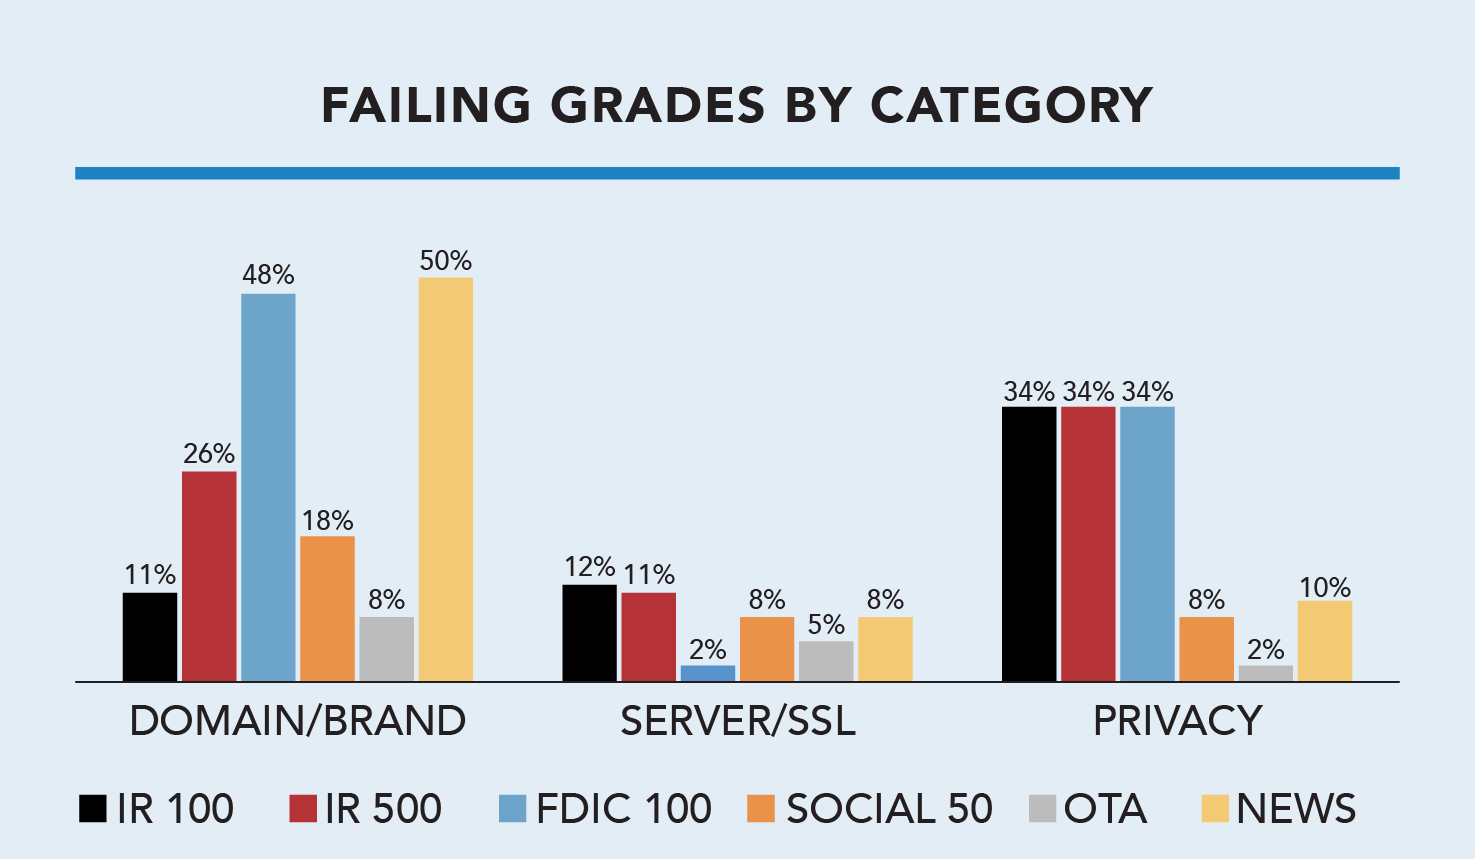
Figure 3 – Email, Domain & Brand Protection